Beer's Law
The relationship on the preceding page relates the amount of light transmitted
through the sample to the concentration and cell width. We frequently like
to think in terms of how much light is absorbed by the sample, so
we define a new term, absorbance (A):
 (4)
(4)
Making all of the appropriate substitutions, we get:
 (5)
(5)
or,
 (6)
(6)
This equation is known as Beer's Law, which shows the linear relationship
between the absorbance and the concentration of the absorbing species.
In chemical analyses, the following three methods can utilize Beer's Law:
- Absolute Calculations
Absorptivity or molar absorptivity is calculated by measuring the absorbance
of a standard of known concentration in a cell known cell width. This calculated
value is then used to determine an unknown concentration of the same absorbing
species from the absorbance measurement at that concentration.
- Working Curve Analysis
The absorbance of a series of three to five standard solutions are measured
and plotted on graph paper against the concentrations of these standards.
This is known as a Beer's Law plot. The absorbance of an unknown concentration
is then measured, and its concentration is determined directly from the
plot. This method is more commonly used than the absolute calculation, because
experimental error will average out over the number of standards.
Figure 3: Beer's Law Plot
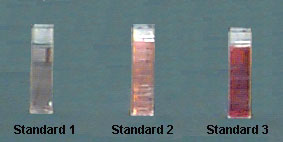
Figure 4: Example of change in color as concentration of solution increases.
- Standard Addition Analysis
This method is used when certain matrix interferences may cause problems
with the measurements. The assumption is that the interference will act
equally on the analyte and on an standard added to analyte. In this case,
the sample is measured (A1), and then a second portion of the sample is
spiked with a standard and this is measured (A2).
We will use the first two methods in the laboratory experiment.