Laboratory Procedures
Measuring the Molar Absorptivity
Procedure
- Prepare 150 ml of a 1 × 10⁻³ M KMnO4 (potassium
permanganate) solution.
Show calculations:
- Rinse one of the polystyrene cells with the distilled water and fill it
with the water. Put the cell in the first sample compartment.
- Rinse a second polystyrene cell twice with distilled water, and fill it
with the KMnO4 solution. Put the cell containing KMnO4
in the second sample compartment.
- Set the wavelength of the spectrophotometer to 400 nm and move to cell
rack to B (blank); push [Auto zero].
- Move the cell rack so that the second compartment is read. Record the
result on the report sheet.
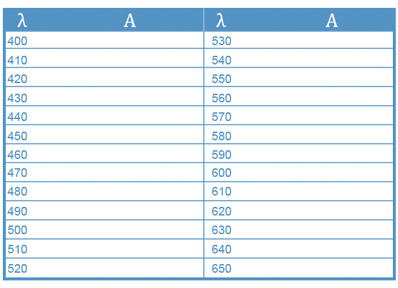
- Repeat steps 4 and 5 for wavelengths from 410 nm to 650 nm at 10 nm intervals.
Be sure to re-zero the instrument at each wavelength.
Results
- Plot the absorbance for each wavelength measured on Cartesian paper
(either hand plot or use Excel).
- Draw a smooth curve through the data points.
- Determine the wavelength at which the KMnO4 absorbs the most. From the graph, determine the absorbance at this point. Using the absorbance value and the concentration of the KMnO4 solution, calculate the molar absorptivity at this wavelength. The width of a polystyrene cell is 1 cm.
- Calculate the molar absorptivity.
Absorption maximum wavelength: ________________ nm
Absorbance: _________________
Molar absorptivity: _________________ l/M-cm
Constructing a Beer's Law Plot
A Beer's Law plot will graphically show the relationship between the amount
of light absorbed by an absorbing species and the concentration
of that species. Construct a Beer's Law plot using a series of standard potassium
permanganate solutions, and use that information to determine the concentration
of an unknown solution.
Procedure
- In preparation of this experiment, clean and rinse the following equipment
with distilled water: four Erlenmeyer flasks, a 100 ml volumetric flask, and
a 50 ml burette.
- Rinse the burette twice with small portions (about 5-10 ml) of the KMnO4
solution prepared in the previous experiment to remove any residual water.
Allow the rinses to drain through the stopcock into a waste beaker for later
disposal. Fill the burette to the top calibration line (50 ml) with the KMnO4
solution.
 View a video demonstration on how to use a volumetric burette
- Deliver 5.0 ml of the stock from the burette into the 100 ml volumetric
flask. Dilute the flask to the mark with distilled water, cap the flask, and
mix the diluted solution thoroughly. Rinse one of the erlenmeyer flasks with
small portions of this diluted standard and discard the rinses into the waste
beaker. Finally, transfer the remaining diluted standard to the erlenmeyer
flask for storage. Calculate the concentration of this standard, and label
the erlenmeyer flask. Record the result on the report sheet.
- Rinse the volumetric flask with distilled water, and then repeat step
3 for 10.0 ml, 20.0 ml and 50.0 ml of the stock from the burette.
- After the four standard solutions have been prepared, rinse the volumetric
flask with water, and get 5 ml of unknown sample. Dilute the solution to the
mark and mix thoroughly.
- Refer to the absorption spectrum in the previous experiment, and choose
the wavelength at which the maximum absorbance was measured. Set the SPECTRONIC
Genesys 5 to that wavelength. Use distilled water as a blank.
- Rinse one of the polystyrene cells with distilled water and fill it with
the water. Place it in the first sample compartment. Rinse another cell with
small portions of the first standard solution, and fill it with the solution.
Put the cell in the second sample compartment. Repeat the rinse/fill for the
other standard solutions using additional cells and put them in sample compartments
3-5. Repeat the procedure with the unknown, and put in sample compartment
6.
- Put the sample tray in the blank position. Push [Auto Zero]. Then measure
the absorbance of each of your solutions.
Results
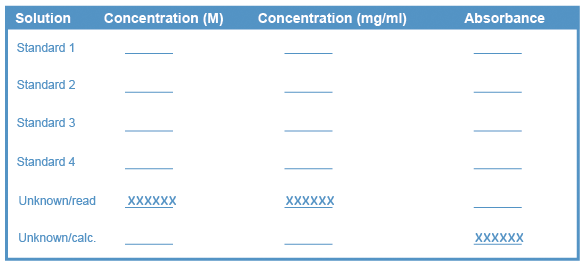
- Using Excel graphics, plot the absorbance versus concentration of
the KMnO4 standard solutions. Create a trend line and print the equation of the trend line. This is the Beer's Law standard curve.
- Mathematically calculate the unknown solution concentration from
the following equation:

Determine the pKa of a Weak Acid
The strength of an acid is indicated by the numerical value of its acid hydrolysis
constant (Ka). This is a measure of the extent of the reaction:

where:

In this experiment, you will calculate the Ka for a weak acid by controlling
the pH of the solution and measuring the concentrations of the acidic and basic
forms of the acid. The acid chosen is bromcresol green, which is unique in that
its acidic and basic forms are colored in the visible region of the spectrum.
These types of compounds are frequently called dyes and are used as indicators
of the pH of a solution. If we represent the hypothetical form of this weak
acid as HIn, then:

where:

The concentrations of the acidic and basic forms can be calculated from absorbance
measurements, once the molar absorptivities for these forms at the appropriate
wavelengths have been determined.
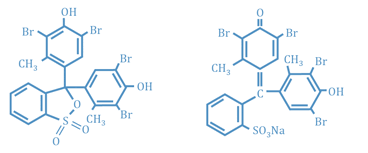
The formula for bromcresol green and its sodium salt are:
| C21H14Br4O5S (F.W. = 697.98) |
C21H13Br4O5SNa (F.W. = 719.97) |
Procedure
- Prepare 100 ml of a 0.120 g/L solution of bromcresol green using the liquid
aliquot method. Show your calculations on the data sheet under prelab data.
You have been given sodium bromcresol green because it will dissolve faster
in water than the free acid. REMEMBER TO CORRECT FOR THE DIFFERENCE IN FORMULA
WEIGHT BETWEEN BROMCRESOL GREEN AND SODIUM BROMCRESOL GREEN. You want a solution
that is 0.120 g/L of the free acid. In preparation for this experiment, clean
and rinse the following glassware with distilled water: a 100 ml beaker, a 10
ml pipette, a 100 ml volumetric flask, a graduate cylinder, three erlenmeyer
flasks.
- Pour the bromcresol green dye solution into a 100 ml beaker.
- Pipette a 10.0 ml sample of the dye solution into the 100 ml volumetric
flask, add 10 ml of 0.10 M HCl, dilute to the mark, and mix thoroughly. Transfer
the solution to a clean, dry erlenmeyer flask. Label this flask acidic form.
Calculate the concentration of the dye and record the result on the report sheet
(assume that all of the dye exists as HIn in this solution).
- Rinse out the volumetric flask, and pipette another 10.0 ml sample of the
dye into it. Add 10 ml of 0.10 NaOH, dilute, mix, and transfer to a second erlenmeyer
flask. Label this flask basic form. Calculate the concentration of the
dye and record the result on the report sheet (assume that all of the dye exists
as In- in this solution).
- Rinse out the volumetric flask again, and pipette a third 10.0 ml sample
of the dye solution. Add 10 ml of the acetate buffer, dilute, mix, and transfer
to a third erlenmeyer flask. Label this flask mixed forms.
- Fill one of the polystyrene cuvettes with water, and another with the acidic
form dye solution. Put the cuvette containing water in the first sample
compartment (blank) and the cuvette with the dye solution in the second compartment.
- Set the wavelength of the UV/VIS spectrophotometer to 350 nm, and push
[Auto Zero].
- Measure and record the absorbance of the acidic form of the dye on the
report sheet.
- Change the wavelength to 400 nm and repeat steps a and b at 50 nm intervals
up to 650 nm. Adjust the blank to zero absorbance before each reading.
- Determine the wavelength region of maximum absorbance in part c., and
repeat steps a through b at 10 nm intervals above and below the region. For
additional accuracy, repeat at 5 nm intervals. Record absorbances on the report
sheet.
- Fill a third cell with the basic form of the dye. Repeat the procedure
in step 6 a-d to determine the wavelength of maximum absorbance for the basic
form of the dye.
- Set the wavelength of the spectrophotometer to the wavelength maximum of
the basic form. Move the sample tray to the cell containing water (blank).
Push [Auto Zero].
- Fill the fourth cuvette with the mixed forms of the dye. Measure
the absorbance of the mixed forms of the dye at this wavelength and record
the result on the report sheet.
- Set the wavelength of the spectrophotometer to the wavelength maximum of
the acidic form. Move the sample tray to the B (blank) position and push
[Auto Zero]. Measure the absorbance of the mixed forms of the dye at
this wavelength and record the absorbance on the report form.
Calculations
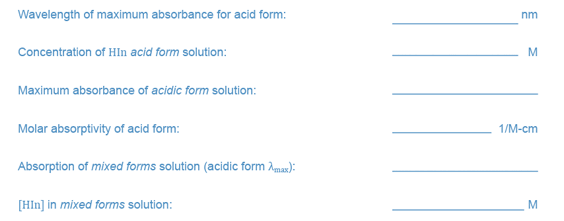
- Using Beer's Law, the maximum absorbance of the acidic form solution
and the concentration of HIn in the solution, calculate the molar absorptivity
of HIn at the maximum absorbance wavelength. The width of the cuvette is 1
cm. Record the result on the report sheet.
- Using the molar absorptivity of HIn calculated in step 1 and the absorbance
of the mixed forms solution at the wavelength maximum for the acidic
form, calculate [HIn] in the mixed forms solution.
- Using Beer's Law, the maximum absorbance of the basic form solution
and the concentration of In- in the solution, calculate the molar
absorptivity of In- at the maximum absorbance wavelength. The width
of the cuvette is 1.0 cm. Record the result on the report sheet.
- Using the molar absorptivity of In- calculated in step 3 and
the maximum absorbance of the mixed forms solution at the wavelength
maximum for the basic form, calculate [In-] in the mixed
forms solution.
- Using the pH of the buffer used for the preparation of the mixed forms
solution, calculate the [H+] and record the result on the report
sheet.
- Insert the values of [HIn], [In-], and [H+] into
the equation for Ka and calculate the value of the acid hydrolysis constant
for bromcresol green. Record the result on the report sheet.
Results
Show calculations for the liquid aliquot method used for preparing 100 ml of
the bromcresol green solution (0.120 g/L).
Acidic Form of the Dye

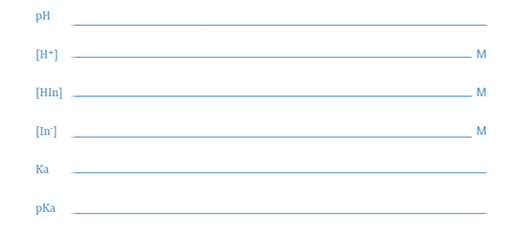
From Table (i), wavelength region of maximum absorbance = ____________ nm
Make absorbance measurements every 10 nm intervals above and below the wavelength
of maximum absorbance from Table (i).

From Table (ii), wavelength region of maximum absorbance = ____________ nm
Make absorbance measurements every 5 nm intervals above and below the wavelength
of maximum absorbance from Table (ii).

- From Table (iii), the maximum wavelength of the acidic form of the dye
= ________ nm
- 2. Maximum absorbance of the acidic form = __________
Basic Form of the Dye

From Table (iv), wavelength region of maximum absorbance = ____________ nm
Make absorbance measurements every 10 nm intervals above and below the wavelength
of maximum absorbance from Table (iv).
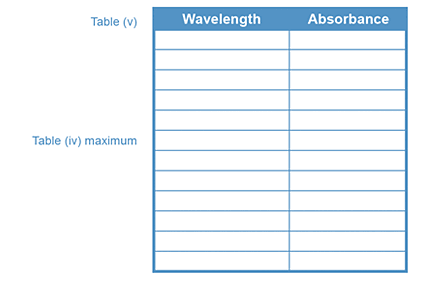
From Table (v), wavelength region of maximum absorbance = ____________ nm
Make absorbance measurements every 5 nm intervals above and below the wavelength
of maximum absorbance from Table (v).
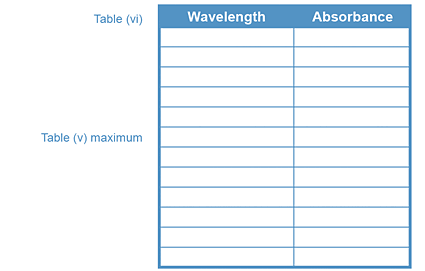
- From Table (vi), the wavelength maximum of the basic form of the dye =
__________ nm
- Maximum absorbance of the basic form = __________
Absorbance of the mixed form of the dye at the wavelength maximum ( _____ nm)
of the basic form = __________
Absorbance of the mixed form the dye at the wavelength maximum ( _____ nm)
of the acidic form = __________
Report Sheet
- Calculations (acidic form of dye)
- Calculations (basic form of dye)

- Calculation of Ka
